Bitcoin does not have one official price. It trades on hundreds of separate exchanges, and each one has its own buyers, sellers and orders.
Because of this, the same coin can sell for slightly different amounts at the same moment. A price of $100,000 on one platform and $100,250 on another can both be correct.
This article looks at the numbers behind those gaps. It covers order books, liquidity, fees, stablecoins, regional premiums, arbitrage and the tools that average prices across markets.
Most examples here are hypothetical and are marked that way. Real figures come from published research and exchange documentation, which are listed at the end.
Key Statistics at a Glance
The table below collects the main figures used in this article. Some come from research. Others come from hypothetical examples that show how pricing works.
| Figure | What it shows | Type |
|---|---|---|
| 0.45% | Gap between the highest and lowest of four example exchange prices | Hypothetical |
| $100 | Example bid-ask spread on a $100,000 Bitcoin | Hypothetical |
| 0.75% vs 0.10% | Example trading fees on two exchanges | Hypothetical |
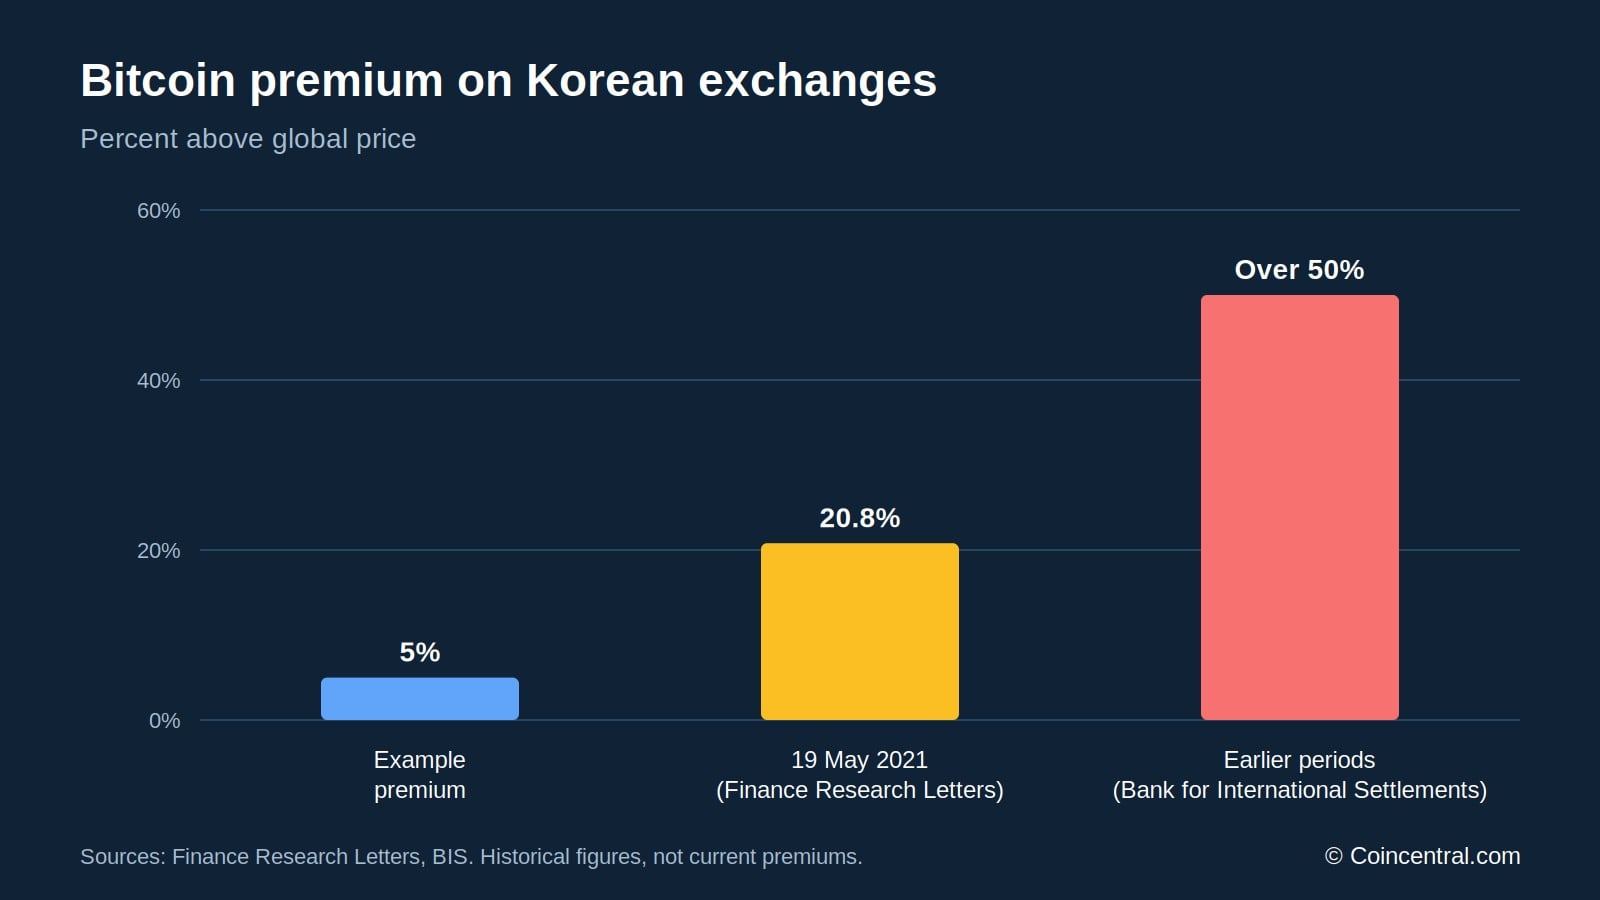
| 20.8% | Korean Bitcoin premium on 19 May 2021 | Finance Research Letters |
| Over 50% | Korean premiums in earlier periods of market disruption | Bank for International Settlements |
| 80 | Exchanges studied in a 2024 working paper on arbitrage spreads | Research paper |
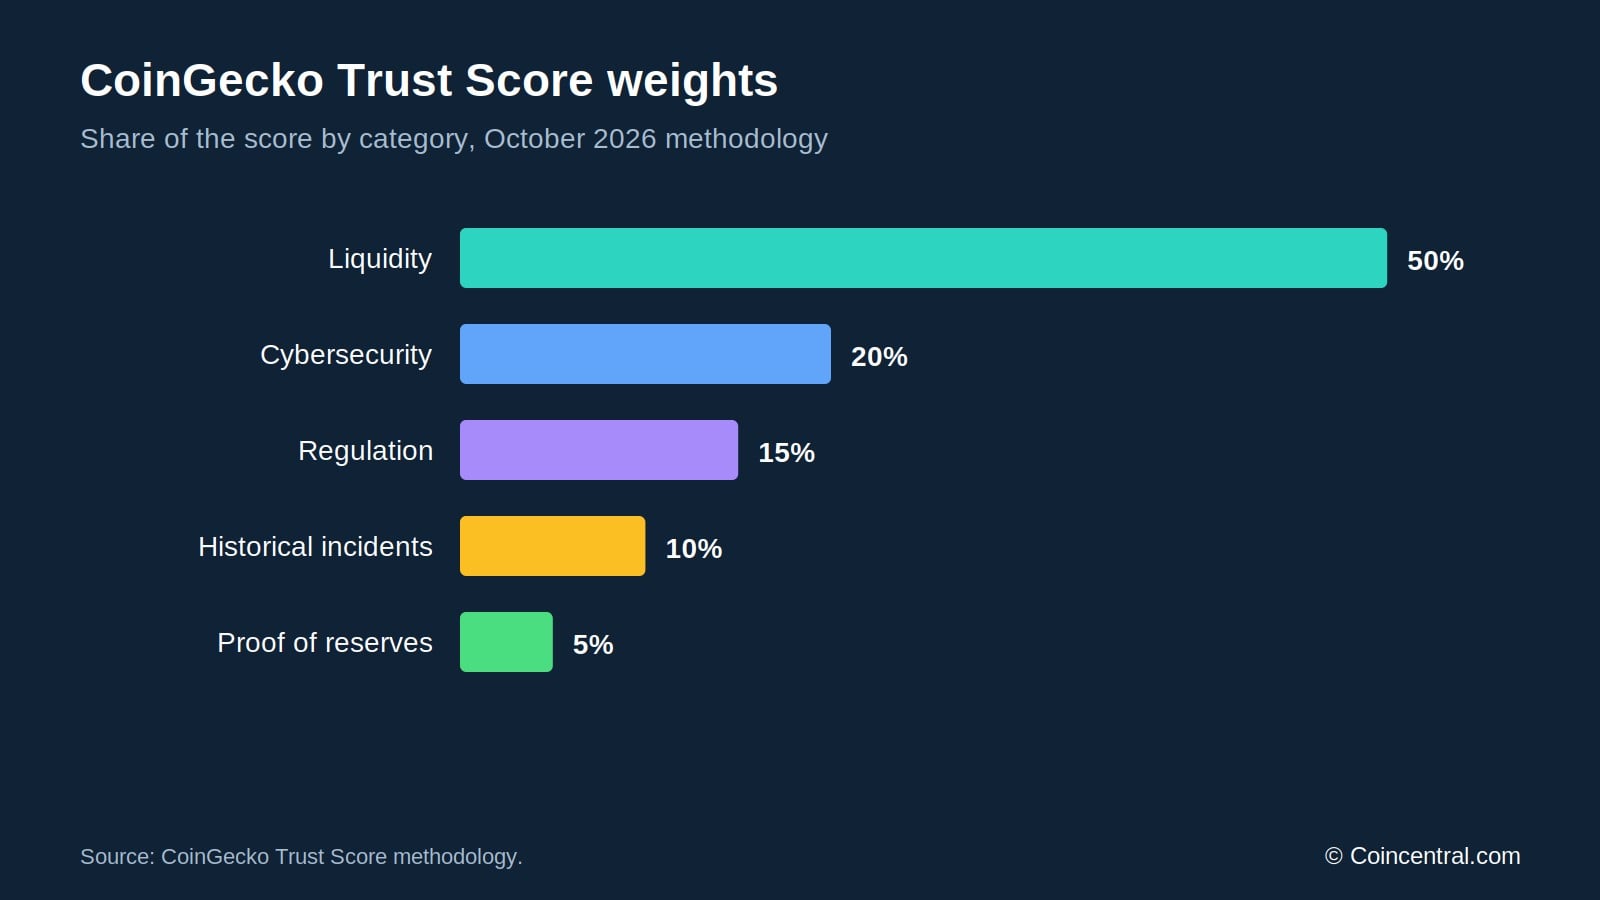
| 50% | Weight given to liquidity in CoinGecko’s Trust Score | CoinGecko |
| $250 | Example arbitrage profit after fees and transfer costs | Hypothetical |
Hypothetical prices show how small gaps can look. In a four-exchange example, prices run from $99,850 to $100,300. That is a gap of $450, or 0.45% of $100,000.
A buyer on the cheapest platform would pay $450 less than a buyer on the highest, before fees. These figures are illustrative and are not live quotes.
Arbitrage traders work to keep such gaps small. They buy a coin where it is cheaper and sell where it is higher. Even so, gaps can last.
Research by Igor Makarov and Antoinette Schoar, published in the Journal of Financial Economics in 2020, found price gaps that came back again and again. They also found that gaps were larger between countries than between exchanges in the same country.
How Order Books Set the Price
Most large centralized exchanges use an electronic order book. It lists the prices at which customers will buy and sell a coin. Buy orders are called bids, and sell orders are called asks.
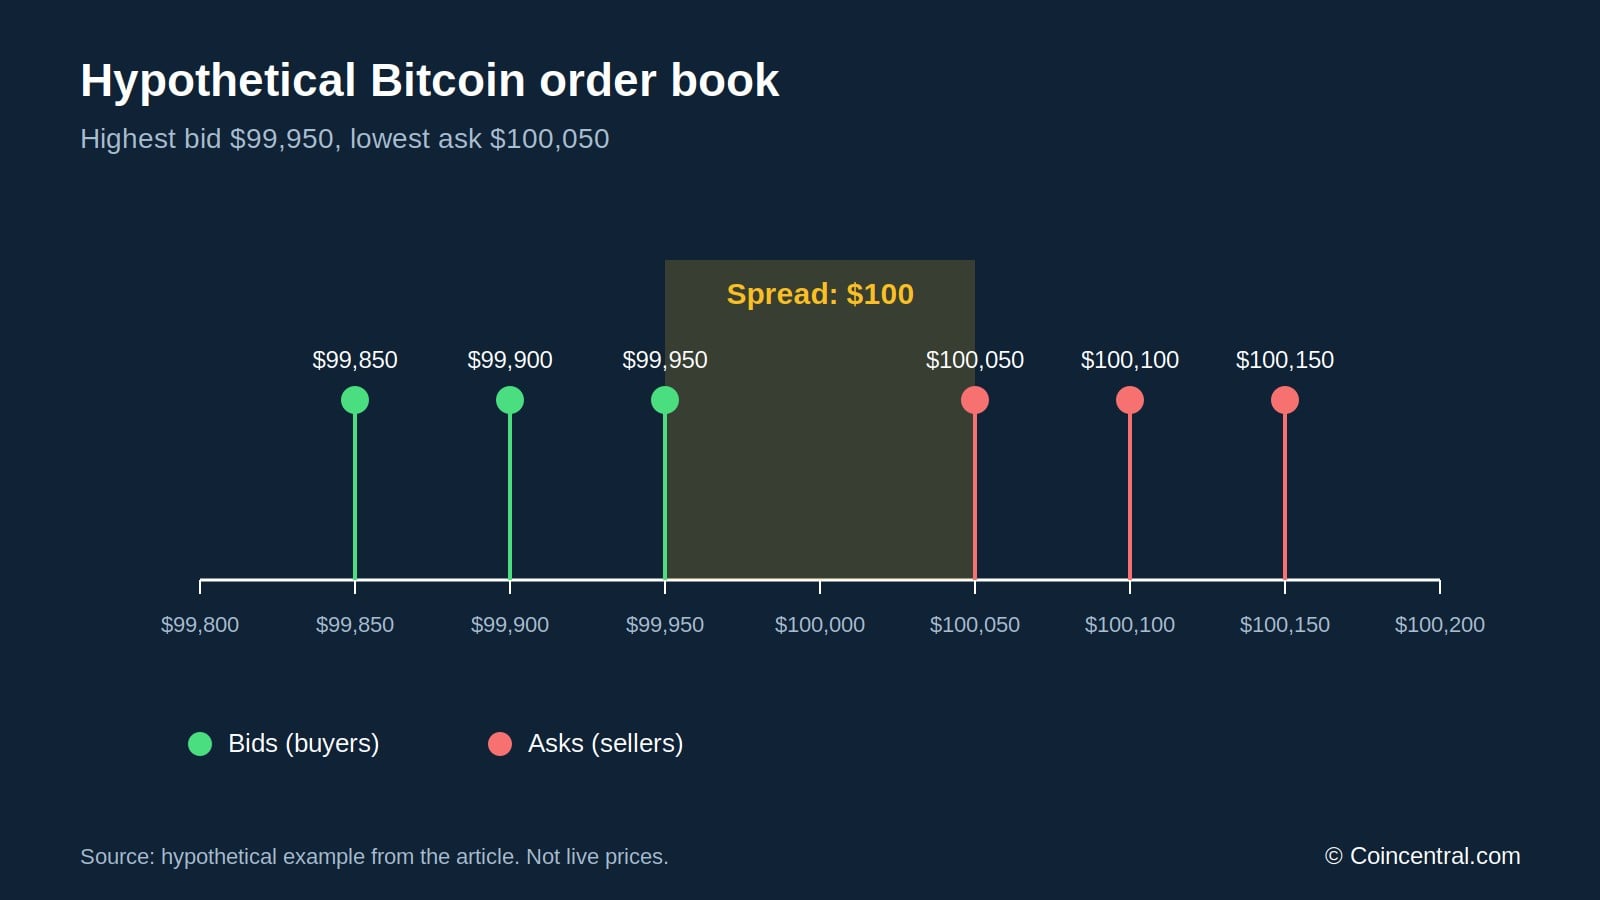
Suppose Bitcoin trades near $100,000. The highest bid is $99,950 and the lowest ask is $100,050. The gap between them is the bid-ask spread, which is $100 in this example.
| Buyers willing to pay (bids) | Sellers asking (asks) |
|---|---|
| $99,950 | $100,050 |
| $99,900 | $100,100 |
| $99,850 | $100,150 |
A market buy order fills against the lowest asks. A market sell order fills against the highest bids. As orders are filled, canceled or replaced, the price moves.
Each exchange keeps its own book. One may have many institutional buyers while another has mostly retail sellers. Even when both markets work normally, the balance of buyers and sellers can differ.
Kraken’s documentation says market orders can fill at different prices depending on how deep the order book is. So there is no rule that every exchange must show the same price at every moment.
Liquidity and Price Impact
Liquidity describes how easily a coin can be bought or sold without moving its price. Kraken lists order-book depth and bid-ask spreads as key measures. Deeper markets let buyers fill larger orders closer to the price on screen.
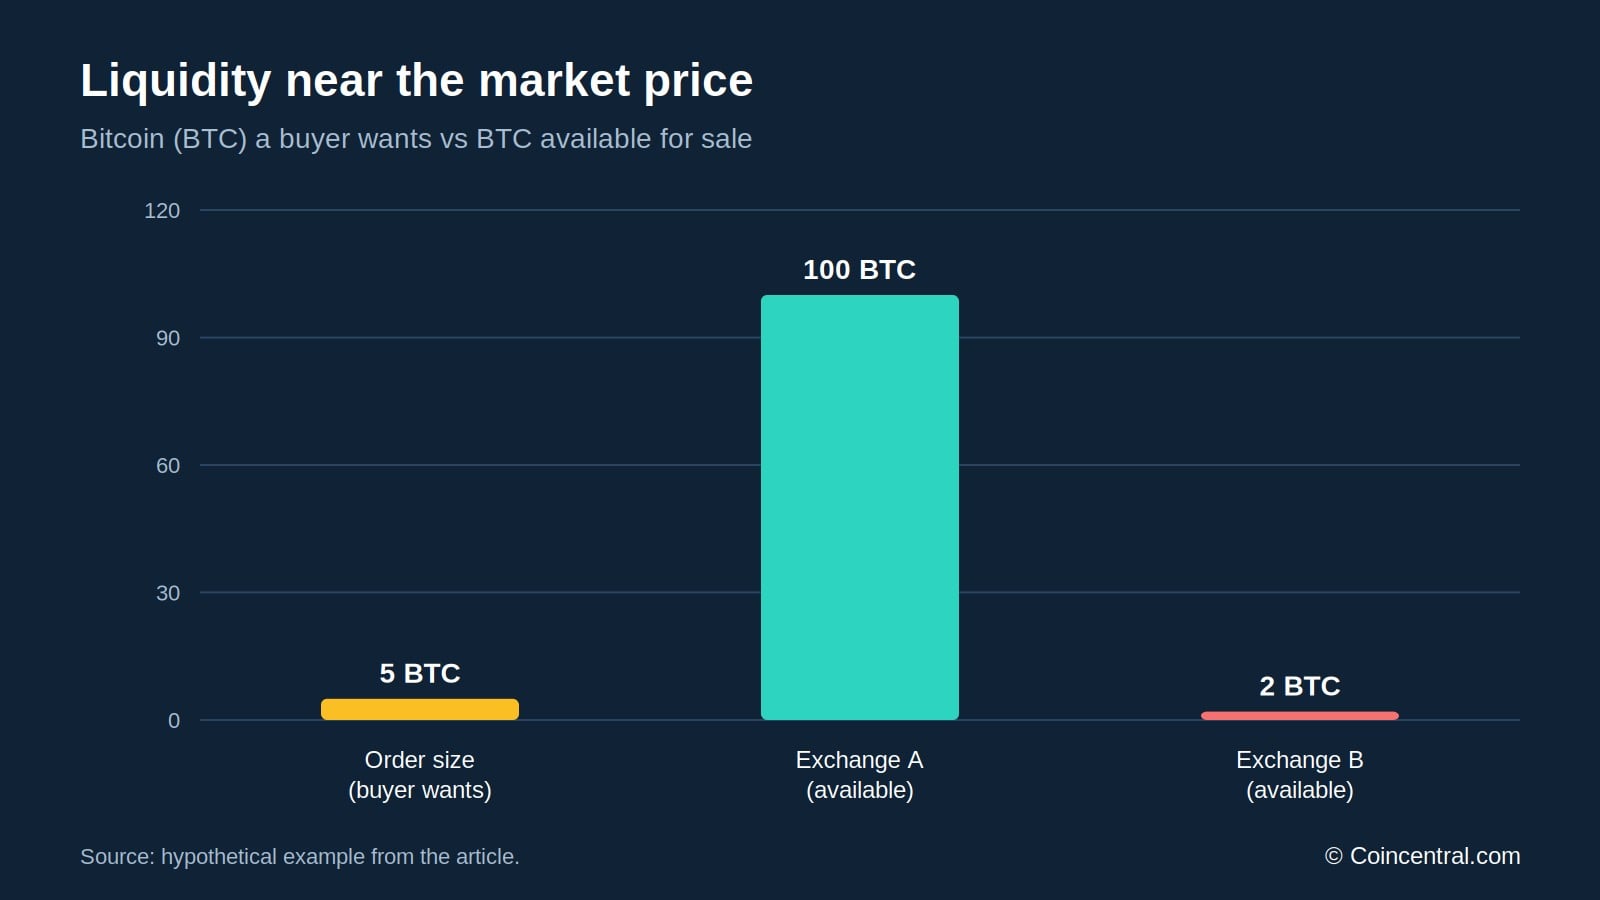
Take a buyer who wants 5 BTC. Exchange A has 100 BTC for sale near the market price. Exchange B has only 2 BTC near that price.
On Exchange A, the order fills with little effect on the price. On Exchange B, the first 2 BTC use up the nearby sellers. The other 3 BTC fill at higher prices, so the average cost rises. This is called price impact.
Slippage and Trading Volume
Slippage is the gap between the price a buyer expects and the price actually paid. Binance.US says order size, liquidity and market volatility are the main factors. Large market orders are most exposed because they can eat through several price levels.
High volume does not guarantee good fills. Two exchanges with similar daily Bitcoin volume can have very different liquidity near the current price. An exchange could report $1 billion in daily volume and still have thin depth for a particular trade.
Smaller Coins and Volatile Markets
The problem is larger for new altcoins and meme coins. A token might show a market value of $10 million while only $50,000 of liquidity is available to trade. A modest sale can then move the price a long way.
Volatility adds to the gaps. Crypto markets run around the clock, and fast news can move one exchange before the others catch up. During sharp drops, liquidity providers may pull orders or widen spreads, so a thin exchange can fall further than a deep one.
A sudden extreme price on a single platform does not mean Bitcoin traded at that level across the whole market.
Fees and Spreads Change What You Pay
The market price and the price a customer pays are not always the same. Some exchanges show an order book with separate fees. Others offer simple buy buttons that build a spread into the quote.
Coinbase shows both models. Its documentation says simple purchases include a spread in the quoted price, which lets the platform lock in a price while it processes the order. Coinbase Advanced gives direct order-book access and charges a volume-based fee instead.
| Cost | Exchange A | Exchange B |
|---|---|---|
| Quoted BTC price | $100,000 | $100,200 |
| Trading fee | 0.75% | 0.10% |
| Fee on 1 BTC | $750 | $100.20 |
| Total purchase cost | $100,750 | $100,300.20 |
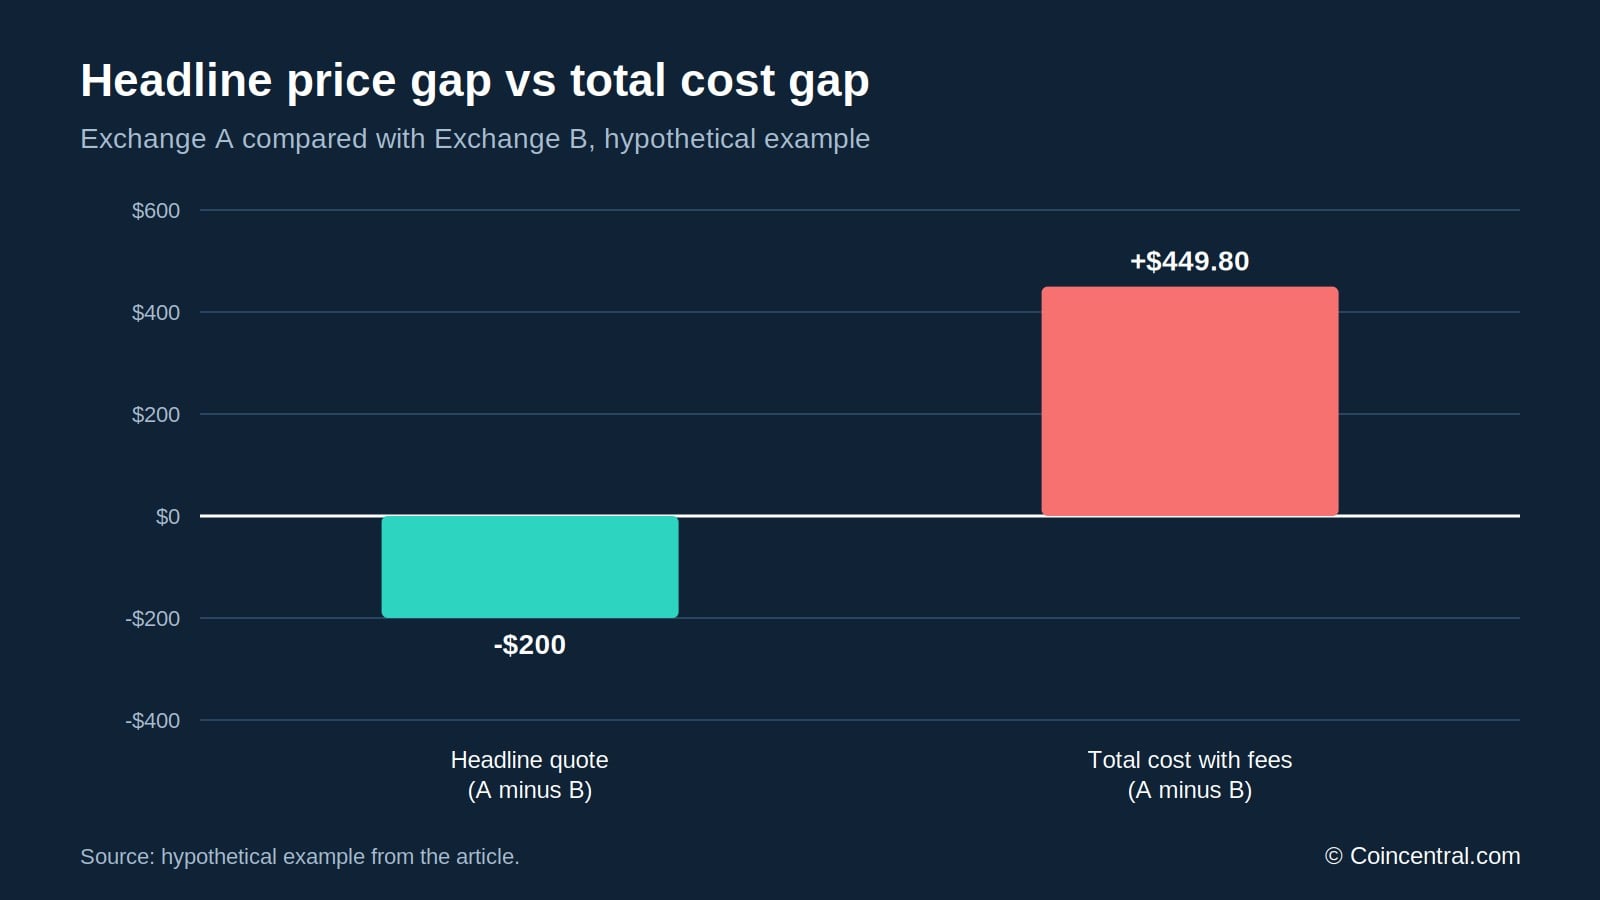
Exchange A quotes a price $200 lower than Exchange B. Its higher fee makes the final purchase $449.80 more expensive. The example leaves out extra spreads, withdrawal costs and slippage.
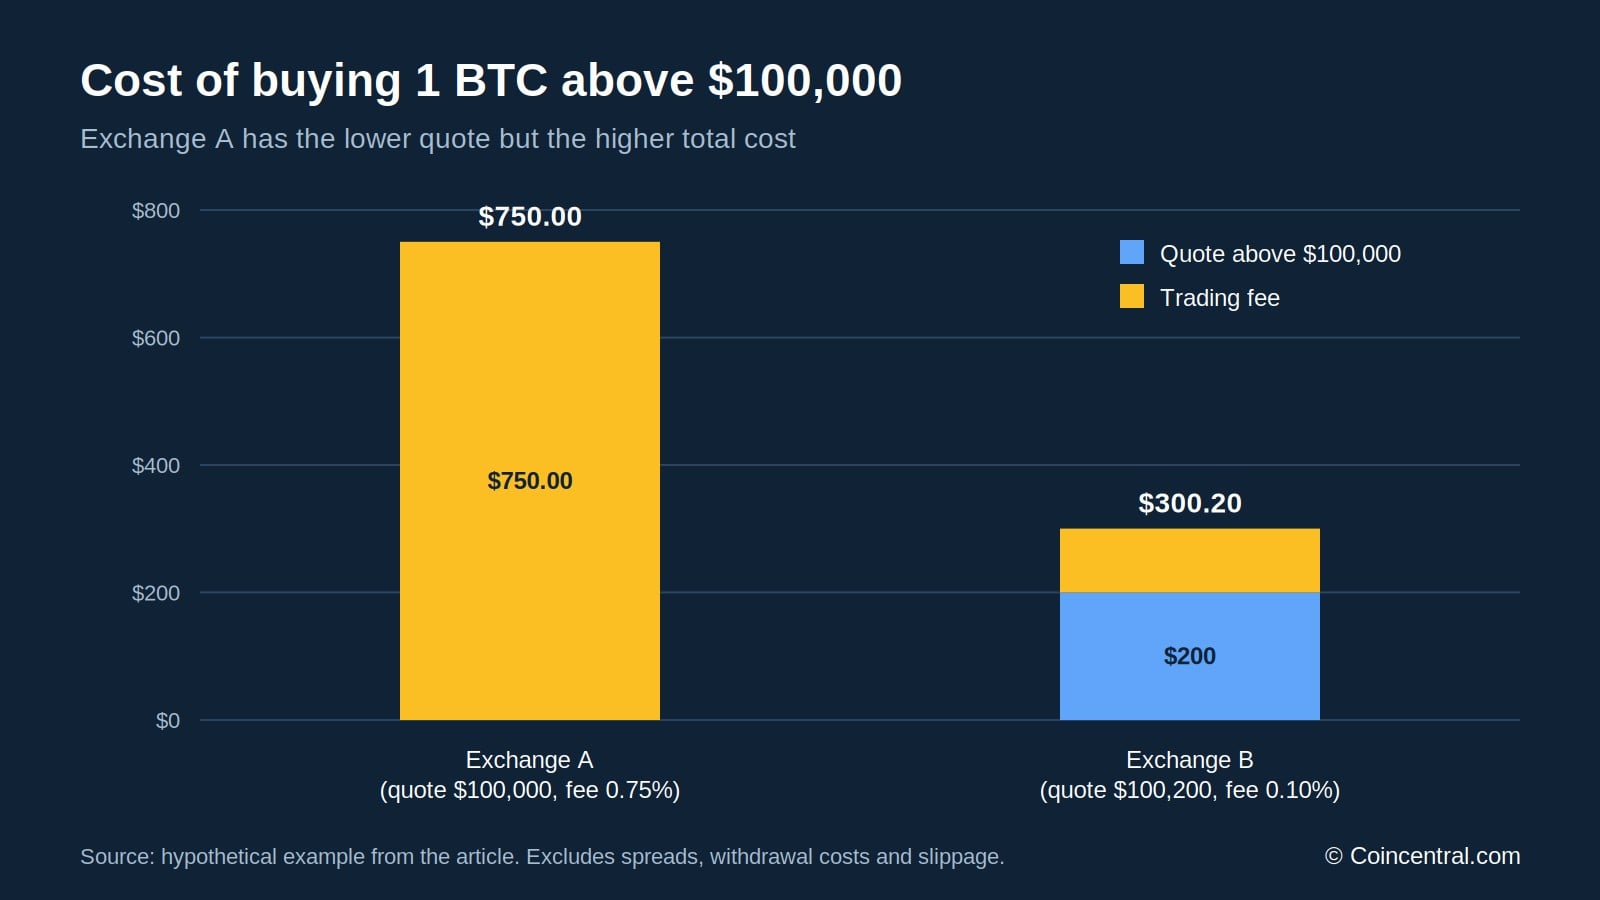
The lesson is to compare the total execution cost. The lowest headline price is not always the cheapest way to buy.
Trading Pairs and Stablecoins
Bitcoin trades in many pairs, such as BTC/USD, BTC/EUR, BTC/USDT and BTC/USDC. Each pair is a separate market. Even after conversion to one currency, the prices may not match exactly.
Say Bitcoin trades at $100,000 on a dollar market and €86,000 on a euro market. At a rate of €0.86 per dollar, the two prices are equal. If the rate moves, or demand rises in one market, the converted prices can drift apart. Conversion fees add to the cost.
Stablecoins add another layer. USDT and USDC are meant to track the US dollar, but their market prices can move. Circle, which issues USDC, says the coin can trade above or below $1 on third-party platforms.
If Bitcoin trades at 100,000 USDT and one USDT is worth $0.995, the implied price is about $99,500. This assumes the conversion can be done without extra costs. A BTC/USD market could show a different price at the same time.
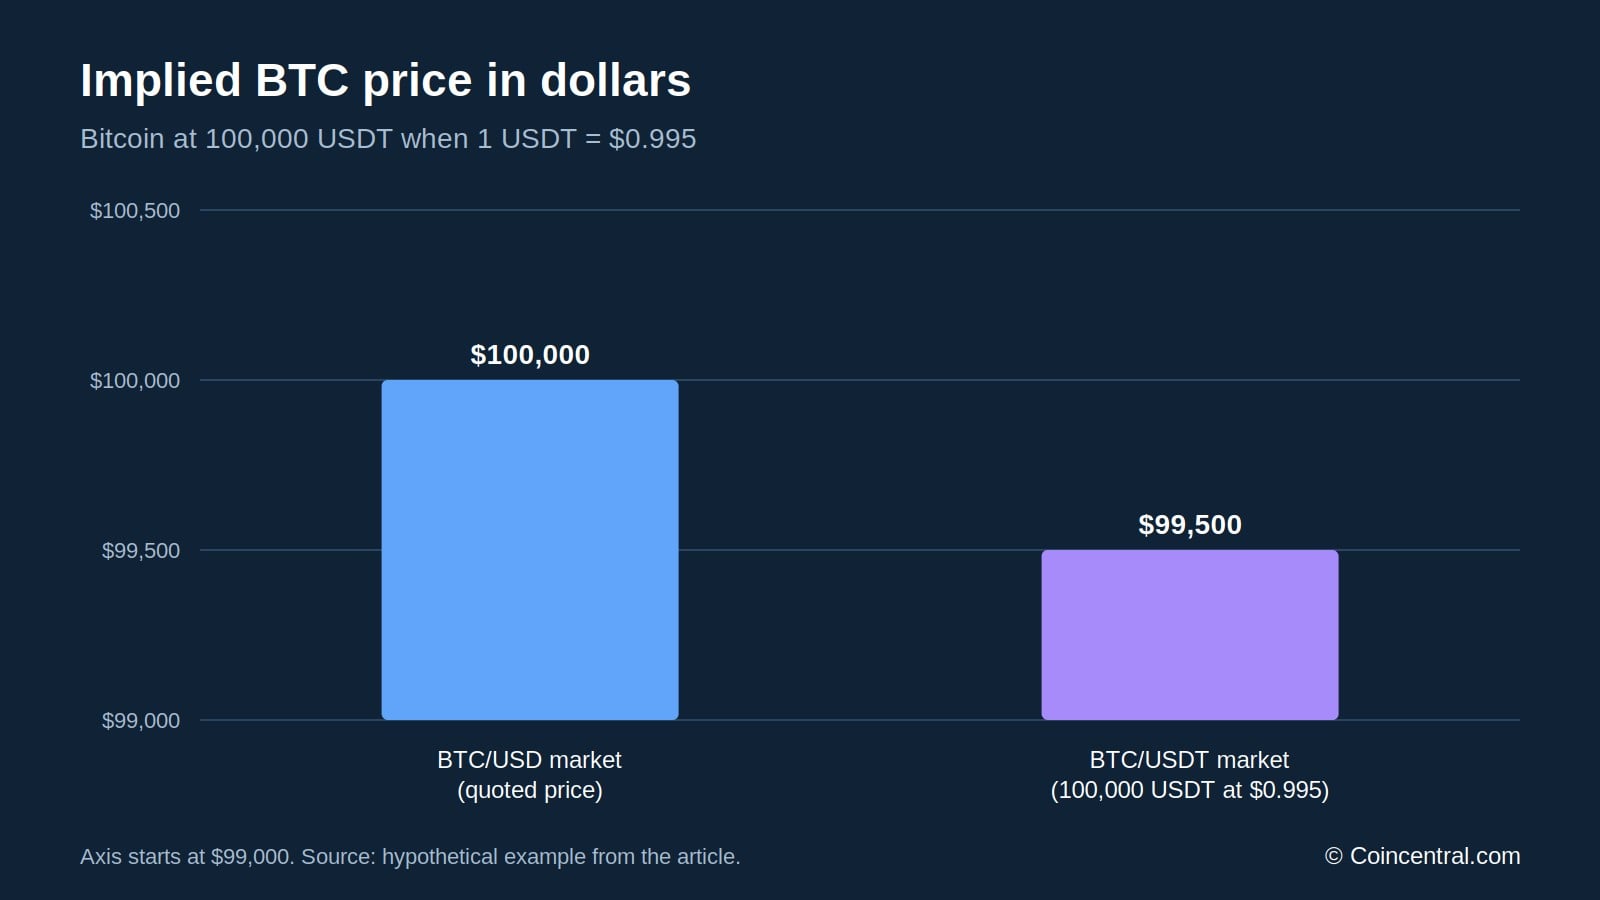
For this reason, a price in USDT or USDC should not be treated as the same number of dollars.
Regional Premiums and Exchange Restrictions
Prices can differ between countries. Local demand, bank limits, currency controls and rules can keep markets from lining up. The best-known case is South Korea’s kimchi premium.
The kimchi premium is when Bitcoin trades higher on South Korean exchanges than on global ones. If Bitcoin costs $100,000 globally and $105,000 on a Korean exchange after currency conversion, the premium is 5%. It can reflect strong local demand or limits on moving money across borders.
| Example | Premium | Source |
|---|---|---|
| Illustrative example | 5% | Hypothetical |
| 19 May 2021 | About 20.8% | Finance Research Letters |
| Earlier periods of market disruption | Over 50% | Bank for International Settlements |
The figures from research are historical. They are not current premiums.
In theory, a trader could buy cheaper Bitcoin abroad and sell it in South Korea. In practice, that may require local bank accounts, foreign exchange services and compliant trading accounts. Limits on cross-border transfers can make the plan hard or impossible.
Makarov and Schoar linked lasting price gaps to market segmentation and limits on moving capital. An apparent gap is not always a free profit.
Restrictions can also make a coin look cheap. Suppose an exchange shows Bitcoin 5% below the global market but has paused withdrawals. A buyer may be unable to move the coins elsewhere, so the discount reflects risk.
CoinMarketCap’s methodology says it may exclude prices from its calculations when exchange restrictions or regional barriers mean they are not freely accessible.
Decentralized Exchanges and Pool Pricing
Not every exchange uses an order book. Platforms such as Uniswap use automated market makers, or AMMs. Users trade against liquidity pools run by smart contracts.
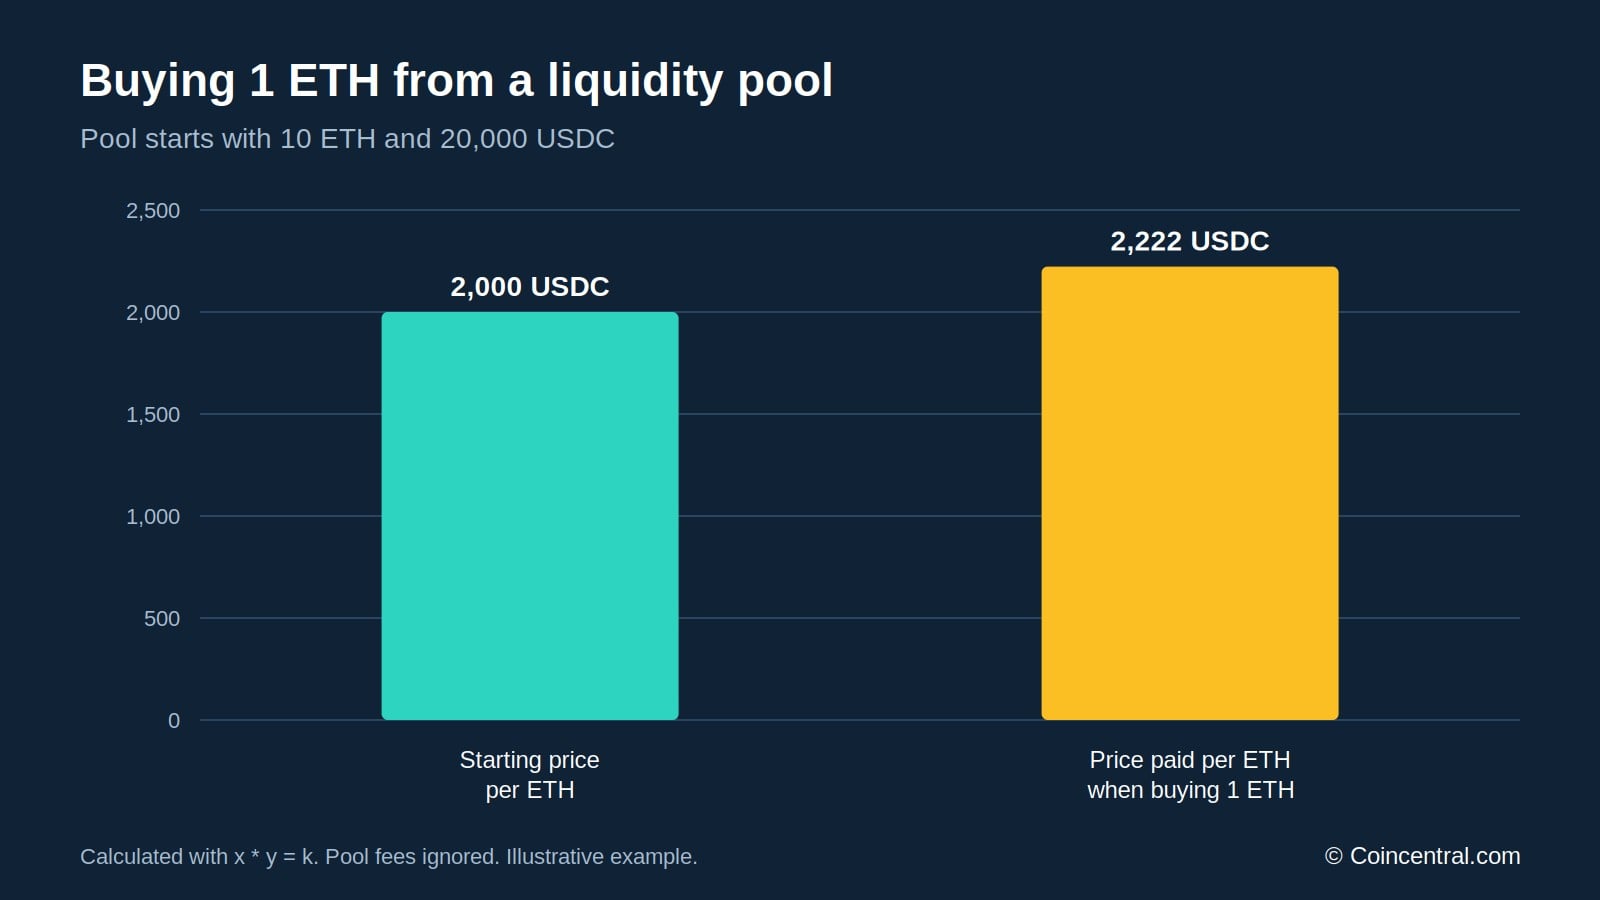
Uniswap’s documentation says its classic model uses the rule x × y = k. Here x and y are the amounts of the two tokens in the pool. The rule sets how the price changes as tokens are swapped. Newer versions also support concentrated liquidity.
Consider a pool with 10 ETH and 20,000 USDC. The starting price is 2,000 USDC per ETH, and k equals 200,000.
A buyer takes 1 ETH out of the pool. The pool then holds 9 ETH, so it must hold about 22,222 USDC to keep k the same. The buyer pays about 2,222 USDC, which is 11.1% above the starting price. This is a simple calculation that ignores pool fees.
A coin can trade in several pools at once. Each pool has different reserves and trading activity, so prices can differ for a time. Arbitrage traders buy from cheaper pools and sell into pricier ones.
Gas fees, slippage and the order of transactions on the blockchain add costs and risks. Uniswap also warns that some trades can suffer from maximal extractable value, including sandwich attacks.
Arbitrage: Can Price Gaps Make Money?
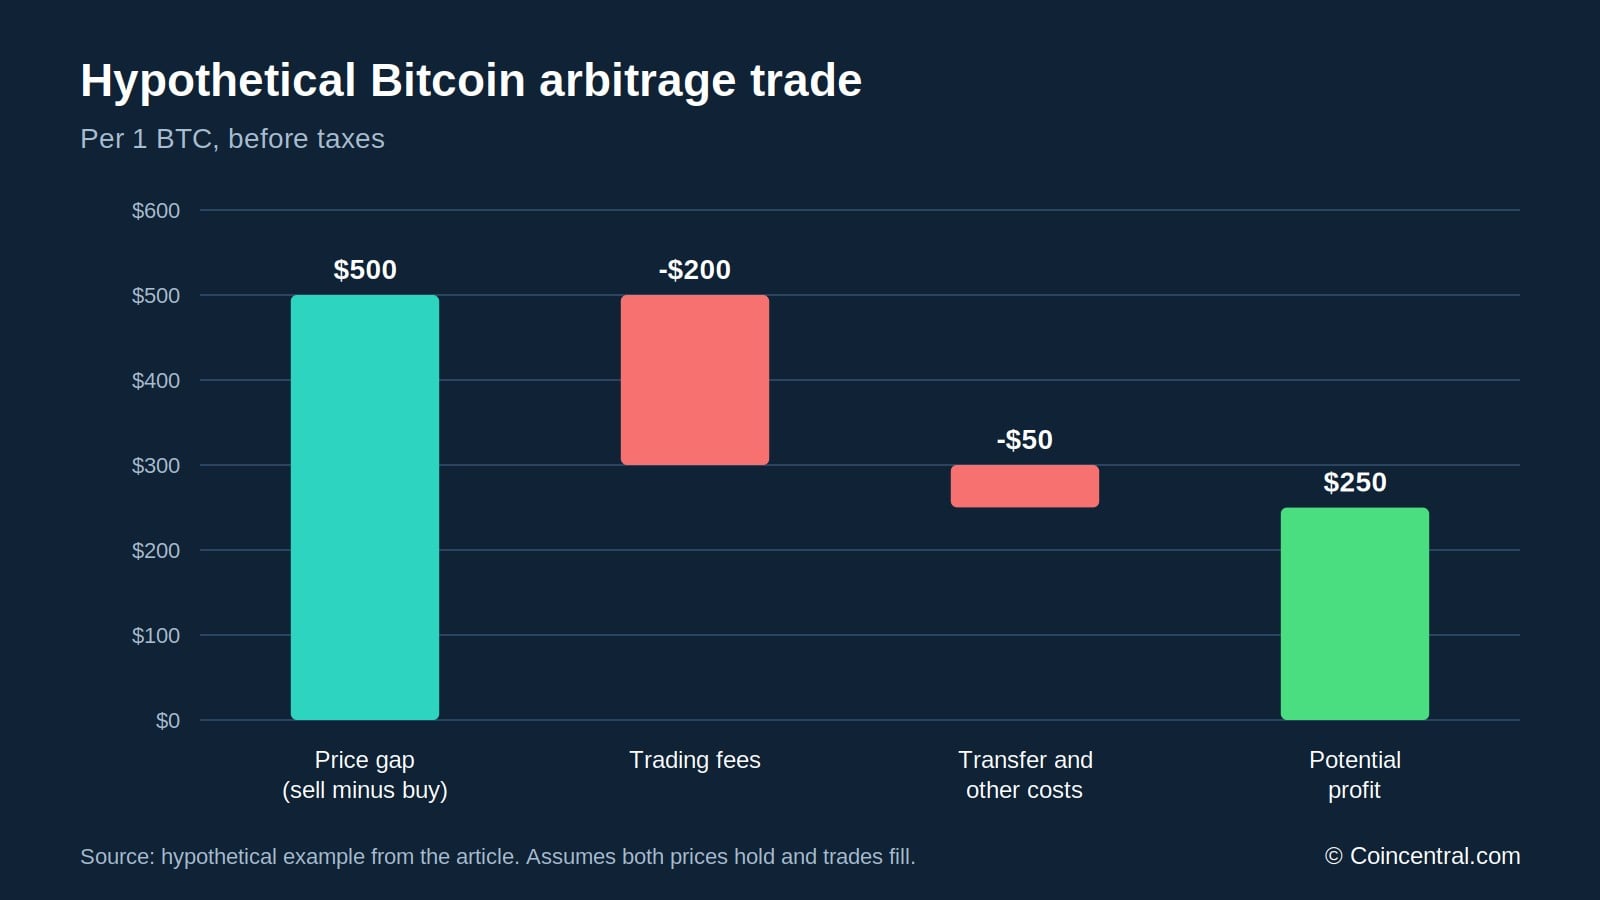
Buying on one exchange and selling higher on another is called arbitrage. It tries to profit from short-lived gaps. The table shows a hypothetical trade.
| Transaction | Amount |
|---|---|
| Buy 1 BTC on Exchange A | $100,000 |
| Sell 1 BTC on Exchange B | $100,500 |
| Gross price difference | $500 |
| Total trading fees | $200 |
| Transfer and other costs | $50 |
| Potential profit | $250 |
The trade earns $250 before taxes, if both prices hold and the orders fill as planned. Real trading is harder. Bitcoin transfers need blockchain confirmations, and exchanges may delay withdrawals.
Prices can change before the second trade fills. Spreads, currency conversion charges and funding costs can erase the gain. Professional traders may hold funds on several exchanges to avoid transfer delays, but that adds custody and counterparty risk.
Makarov and Schoar found that arbitrage opportunities could last for long periods, especially between countries. A 2024 working paper by John, Li and Liu studied 80 exchanges. It found wide variation in arbitrage spreads and reported larger gaps among less trustworthy and more fragmented exchanges.
These findings describe past markets. They do not describe profits available to retail traders today.
Price Aggregators, Futures and Trust Scores
CoinMarketCap and CoinGecko can show a price that differs from any single exchange. They measure different things. CoinMarketCap uses a volume-weighted average of eligible market-pair prices, so markets with more volume have more influence. It also checks for unusual prices.
CoinGecko also uses combined trading data, but its market coverage and data rules may differ. In October 2026 it said regional premiums and decentralized exchange activity can explain gaps between its reference price and exchange quotes. Its data also goes through outlier and liquidity checks.
| Price displayed | What it generally represents |
|---|---|
| Coinbase BTC/USD | Price information from Coinbase’s USD market |
| Binance BTC/USDT | Bitcoin priced in USDT on Binance |
| CoinMarketCap BTC price | Reference price from multiple markets |
| CoinGecko BTC price | Reference price across eligible exchanges |
| Broker buy quote | Price offered to the customer, which may include a spread |
A reference price is a measurement. It is not always a price a customer can trade at.
Futures add another set of prices. Spot trading is the coin itself, while futures give exposure to a future or reference price. A futures contract can trade above or below spot. Binance’s documentation says its mark price uses data from several markets to limit the effect of short-lived dislocations.
CoinGecko also updated its Trust Score method in 2026. Liquidity carries half of the weight, and the model looks at volume consistency and order-book depth. A strong score does not prove an exchange is financially sound.
Price gaps alone are not proof of wrongdoing. Wash trading, spoofing and fake volume do exist, though. A coin trading far below the global price on an unfamiliar exchange may signal poor liquidity, withdrawal limits or operational problems.
How to Compare Prices Before You Buy
The best way to compare exchanges is to look at the full transaction. Start with the same trading pair on each platform. Comparing BTC/USD with BTC/USDT without adjusting for the stablecoin can mislead.
Next, check the spread and depth of the order book. Then add commissions, payment fees, any spread built into the quote and withdrawal fees if you plan to move coins to a wallet.
| Factor | Why it matters |
|---|---|
| Quoted purchase price | Sets the starting cost |
| Trading commission | Adds to the purchase cost |
| Bid-ask spread | Affects the price for immediate execution |
| Order-book depth | Shows how much can be bought near the quote |
| Slippage | Can raise the average price paid |
| Currency conversion | May add costs |
| Withdrawal charges | Matter when moving coins elsewhere |
| Exchange security | Affects custody and counterparty risk |
For larger purchases, a limit order sets the highest price a buyer will pay. It gives more control, but it may not fill. Coinbase Advanced also offers time-weighted average price orders for eligible users, which split a large trade into smaller scheduled parts to reduce market impact.
Bottom Line
Crypto exchanges show different prices because they run independent markets with their own buyers, sellers and liquidity. Bitcoin has no single global price.
For liquid coins such as Bitcoin and Ethereum, competition and arbitrage usually keep prices close. Gaps widen with volatility, thin liquidity or regional limits.
Research in the Journal of Financial Economics shows that gaps can last, especially across borders with capital controls. Fees, spreads and order execution also separate the displayed price from the price paid.
The lowest quote is not always the cheapest purchase. Compare the final cost, fees, spreads and withdrawal terms before you buy.
Three numbers sum up the examples in this article. A $100 spread, a $449.80 cost swing from fees and a 20.8% regional premium each show a different cause of price gaps. None of them alone tells a buyer which exchange is best.
Prices also change by the second. Any figure here is a snapshot or an example, so readers should check live quotes, fees and order-book depth on their own platform before placing a trade.
Disclaimer: This article is for educational purposes only and is not financial or investment advice. Crypto prices, spreads, liquidity and exchange fees change constantly. All hypothetical examples are illustrative and are not live quotes or guaranteed opportunities.
Sources
- MIT Sloan / Journal of Financial Economics (2020): Trading and Arbitrage in Cryptocurrency Markets
- American Economic Association (2019): Price Discovery in Cryptocurrency Markets
- Bank for International Settlements: Regulating Cryptocurrencies: Assessing Market Reactions
- CoinMarketCap (January 2026): How Cryptocurrency Prices Are Calculated
- CoinGecko (October 2026): Why CoinGecko Prices Differ From Exchange Prices
- CoinGecko (October 2026): Exchange Trust Score Methodology
- Coinbase: Cryptocurrency Pricing and Fee Disclosures
- Coinbase: Coinbase vs Coinbase Advanced
- Kraken: Cryptocurrency Trading Glossary
- Kraken: Why Liquidity Matters in Cryptocurrency Markets
- Binance.US (June 2026): Understanding Price Impact and Slippage
- Uniswap: How Uniswap Determines Token Prices
- Uniswap: Price Impact vs Price Slippage
- Circle: USDC Terms and Stablecoin Price Risks
- Binance Futures (2026): Mark Price and Price Index Explained
- John, Li and Liu (2024): Pricing and Arbitrage Across 80 Cryptocurrency Exchanges