
Imagine you’re driving on a highway, and suddenly you see warning signs—”Slippery Road Ahead,” “Sharp Turn Incoming.” You’d slow down, right? The Death Cross is like one of those warning signs, but for traders in the stock and crypto markets. It tells you that a potential market downturn could be on the horizon.
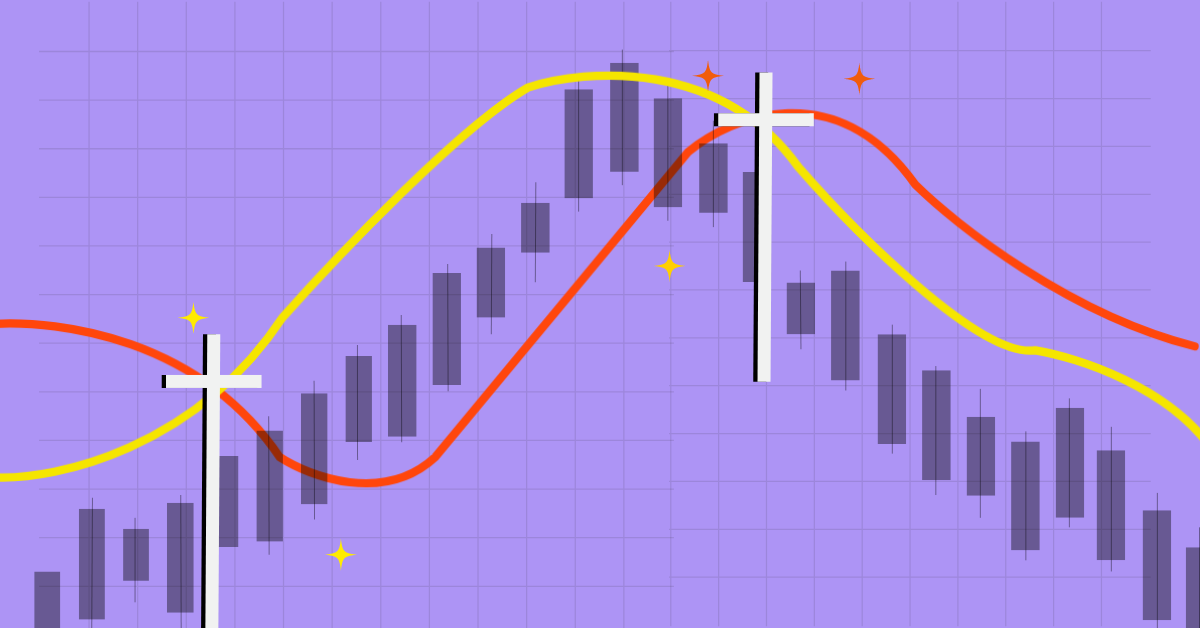
But wait—what exactly is this scary-sounding Death Cross? It’s a technical indicator that happens when the 50-day moving average (MA) crosses below the 200-day moving average on a price chart. Many traders see this as a bearish signal, meaning that the market might head downward.
Now, before you panic, let’s break it down and see how you can use this information to make better trading decisions.
Breaking Down the Death Cross
1. Moving Averages 101
Before we dive deeper, let’s quickly understand moving averages (MA). Think of a moving average as the average price of an asset over a certain period.
- 50-day Moving Average (Short-Term Trend) – This tells you how the price has been moving over the last 50 days. It reacts quickly to price changes.
- 200-day Moving Average (Long-Term Trend) – This is a broader view of price movements over a longer period. It smooths out short-term fluctuations.
When the 50-day MA crosses above the 200-day MA, it’s called a Golden Cross, which is usually seen as bullish (a sign of potential price increases). When the 50-day MA crosses below the 200-day MA, you get the Death Cross—a bearish indicator that suggests a downtrend may be forming.
2. Why Does the Death Cross Matter?
Markets move in cycles. The Death Cross is one of those signals that traders watch closely because it has historically preceded major market downturns. Here are some notable examples:
- 2008 Financial Crisis: The S&P 500 formed a Death Cross in late 2007, right before the market crashed.
- Bitcoin in 2018: After Bitcoin hit its all-time high in December 2017, a Death Cross appeared in March 2018, signaling a long bearish phase.
- Stock Market in 2020: Right before the COVID-19 crash, many stock indices showed a Death Cross pattern.
But does this mean you should sell everything when you see a Death Cross? Not so fast.
Does the Death Cross Always Mean a Market Crash?
Not necessarily. While it can signal a longer downtrend, it’s not a crystal ball. Sometimes, the market recovers quickly after a Death Cross.
Take Bitcoin’s Death Cross in June 2021 as an example. Many traders panicked, expecting a prolonged bear market. However, Bitcoin bounced back within months and reached new highs later that year.
So, what does this tell us? The Death Cross is just one piece of the puzzle. Smart traders don’t rely on a single indicator—they combine it with other factors before making decisions.
How Traders Use the Death Cross
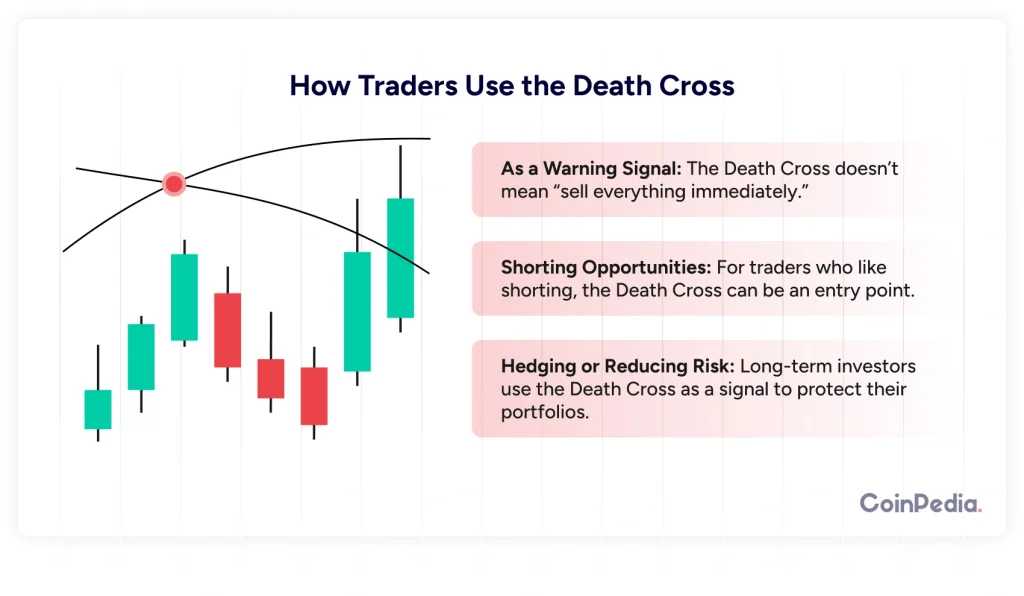
1. As a Warning Signal
The Death Cross doesn’t mean “sell everything immediately.” Instead, think of it as a red flag—a sign to be cautious and analyze the market further. If you see a Death Cross forming, check:
- Overall market sentiment: Are there negative news events, economic downturns, or regulatory changes?
- Trading volume: A Death Cross with high selling volume can confirm a stronger bearish trend.
- Other indicators: RSI (Relative Strength Index), MACD (Moving Average Convergence Divergence), and support/resistance levels can provide additional confirmation.
2. Shorting Opportunities
For traders who like shorting, the Death Cross can be an entry point. If the trend is strong, some traders open short positions to profit from falling prices.
Example:
- If Bitcoin’s 50-day MA crosses below its 200-day MA and there’s high selling pressure, a trader might open a short trade, expecting further downside.
3. Hedging or Reducing Risk
Long-term investors use the Death Cross as a signal to protect their portfolios. Instead of panic selling, they may:
- Reduce exposure: Sell some positions to minimize risk.
- Move to stable assets: Shift funds into cash or stablecoins in crypto markets.
Use stop-loss orders: Set automatic sell orders to protect against major losses.
Common Mistakes Traders Make with the Death Cross
- Overreacting – Just because a Death Cross forms doesn’t mean a crash is guaranteed. Always consider the broader market conditions.
- Ignoring Other Indicators – A Death Cross should be analyzed alongside other technical tools to confirm a bearish trend.
- Not Watching the Volume – If a Death Cross happens with low trading volume, it might be a weak signal.
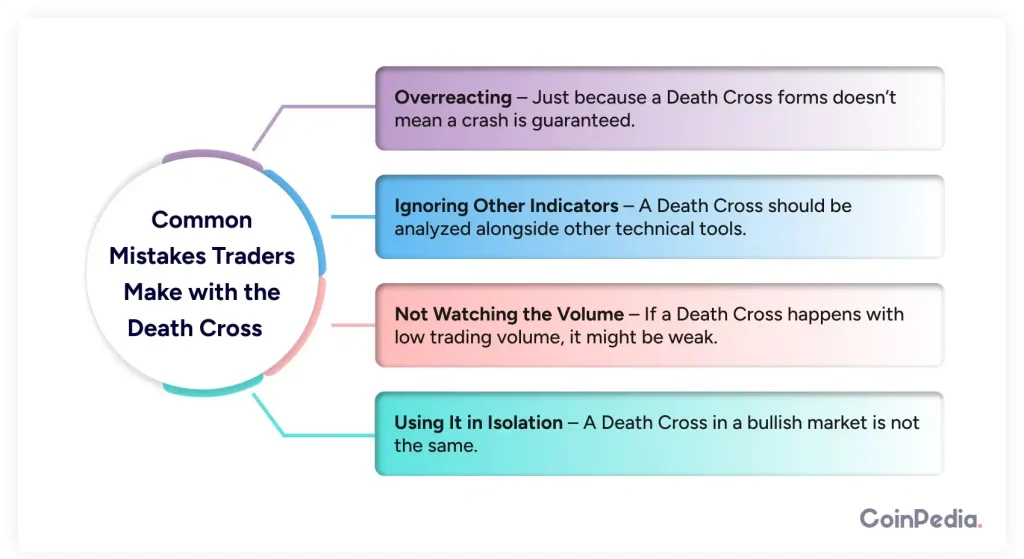
Using It in Isolation – A Death Cross in a bullish market might not have the same impact as one in a weak market.
Final Thoughts: How Should You Approach the Death Cross?
The Death Cross is a useful tool, but it’s not a one-size-fits-all rule. Here’s what you should do:
- Use it as a caution sign, not an automatic sell signal.
- Look for confirmations using other indicators like RSI, MACD, or trendlines.
- Watch market sentiment—news, events, and overall investor mood matter.
- Have a strategy—whether it’s hedging, shorting, or simply observing, don’t trade impulsively.
At the end of the day, the Death Cross is just one tool in your trading toolbox. Use it wisely, stay informed, and trade smart!
FAQs
A Death Cross occurs when the 50-day moving average drops below the 200-day moving average, signaling a potential bearish trend.
Traders use it as a warning signal, to identify shorting opportunities, or to hedge risk by reducing exposure and setting stop-loss orders.
Check market sentiment, trading volume, RSI, MACD, and support/resistance levels to confirm if the Death Cross indicates a strong downtrend.
No, the Death Cross signals a possible downtrend, but markets can recover quickly. It’s best used with other indicators for confirmation.