
You’re watching a stock climb higher and higher. Everyone is excited. The news is full of optimism. Then, suddenly, the price starts to drop. It tries to recover but fails. Before you know it, the price plunges even further. If you knew this would happen, you could have sold at the right time and saved yourself from losses.
This is exactly where the Head and Shoulders pattern comes in. It’s like a warning signal in the market, telling traders that the trend is about to change. If you understand this pattern well, you can avoid getting trapped and even profit from market reversals.
So, let’s break it down in simple terms and make sure you can spot it easily in real-time charts.
What is the Head and Shoulders Pattern?
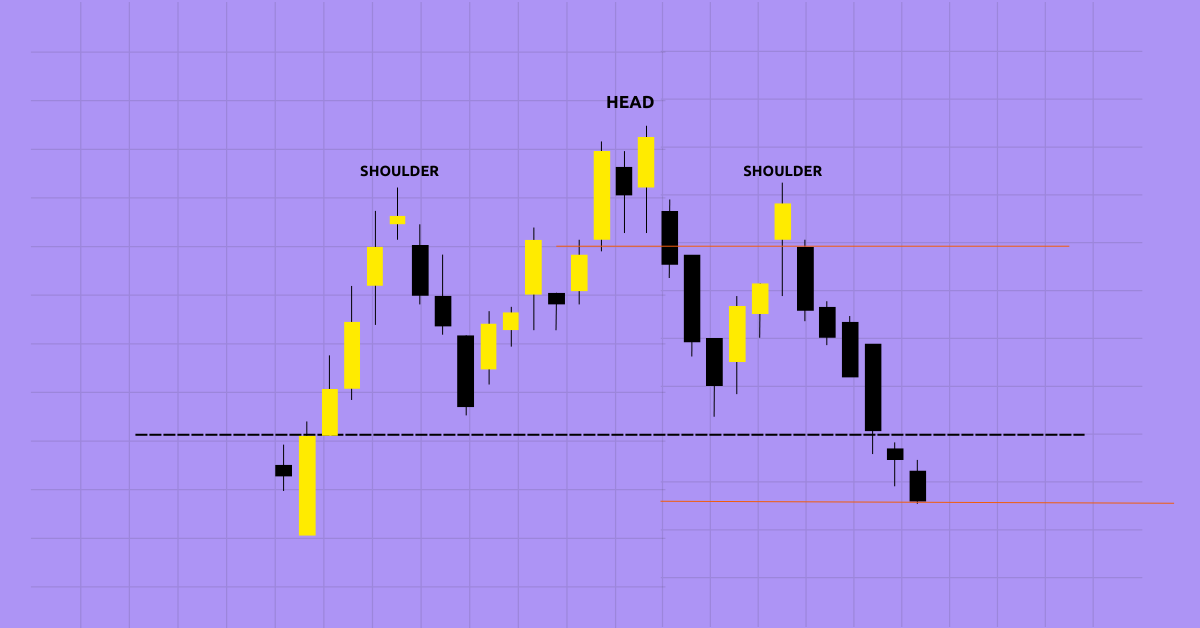
The Head and Shoulders pattern is a chart formation that signals a potential reversal in the market trend. It has three main parts:
- Left Shoulder – The price moves up, then pulls back.
- Head – The price rises even higher, forming the peak, then falls again.
- Right Shoulder – The price makes another attempt to rise but fails to reach the peak of the Head and drops again.
It looks like a person’s head and two shoulders when plotted on a chart, which is why it’s named the Head and Shoulders pattern.
There are two types:
- Bearish Head and Shoulders (Regular Pattern): Signals a trend reversal from bullish to bearish.
- Bullish Inverse Head and Shoulders: Signals a reversal from bearish to bullish.
Let’s dive into both.
Regular Head and Shoulders: Bearish Reversal
How It Works:
- The market is in an uptrend.
- It forms the left shoulder with a high point before pulling back.
- It then rallies higher, forming the head, but retraces again.
- Another push upwards creates the right shoulder, which is lower than the head.
- The price then breaks below the neckline, signaling the end of the uptrend.
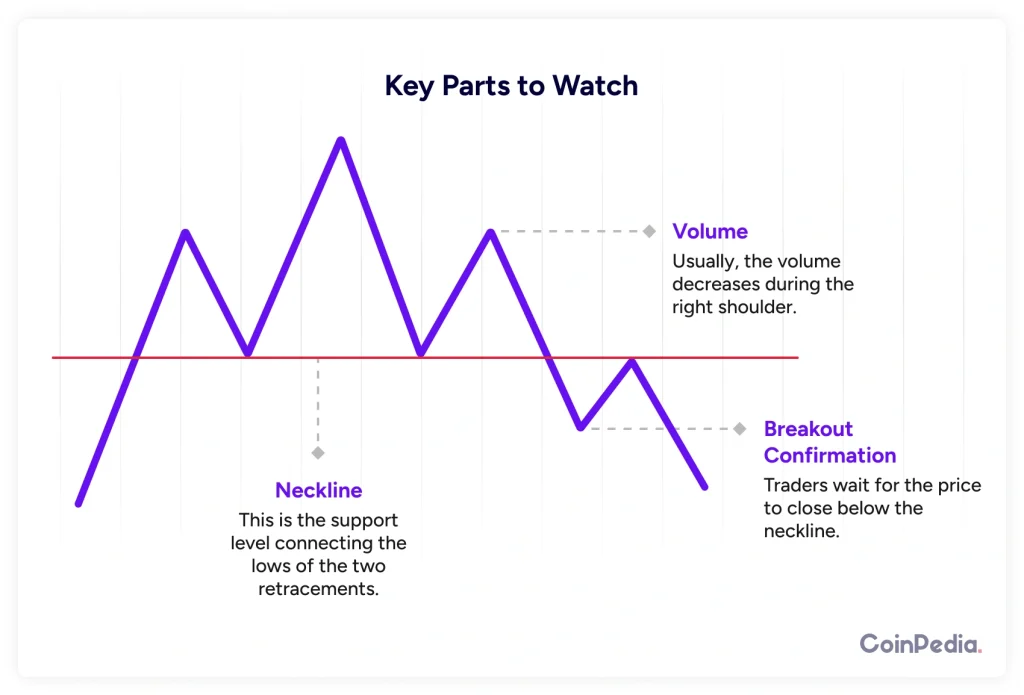
Key Parts to Watch:
- Neckline – This is the support level connecting the lows of the two retracements. When the price breaks below this, the trend has officially reversed.
- Volume – Usually, the volume decreases during the right shoulder, confirming the weakness in the uptrend.
- Breakout Confirmation – Traders wait for the price to close below the neckline before taking a short position.
Example:
Let’s say a stock was rising steadily and peaked at $200 (Head). Before that, it made a high at $190 (Left Shoulder) and after the peak, it tried again but only reached $195 (Right Shoulder). Once it broke below $180 (Neckline), it signaled that the bullish trend was over, and the stock dropped further.
Inverse Head and Shoulders: Bullish Reversal
How It Works:
- The market is in a downtrend.
- It forms the left shoulder with a low before bouncing up.
- It then drops further, creating the head, before bouncing again.
- Another drop follows, but this time, it doesn’t go as low as the head. This forms the right shoulder.
- The price then breaks above the neckline, confirming a trend reversal to the upside.
Key Parts to Watch:
- Neckline – The resistance level connecting the peaks of the retracements. A breakout above confirms the uptrend.
- Volume Increase – The breakout should be supported by high volume.
- Breakout Confirmation – Wait for the price to close above the neckline before going long.
Example:
Bitcoin was falling from $50,000 and made a low at $40,000 (Left Shoulder). It tried to recover but fell again to $35,000 (Head). Then, it bounced back, dropped slightly to $38,000 (Right Shoulder), and then shot up past $42,000 (Neckline), confirming a bullish reversal.
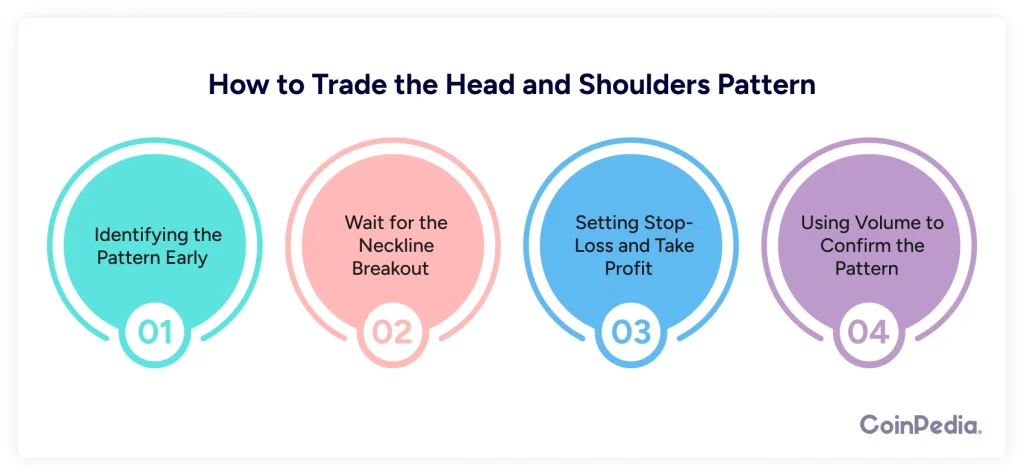
How to Trade the Head and Shoulders Pattern
1. Identifying the Pattern Early
- Watch for the three peaks forming a recognizable Head and Shoulders shape.
- Confirm that the right shoulder is lower than the head (for regular pattern) or higher (for inverse pattern).
2. Wait for the Neckline Breakout
- Short trade: If price breaks below the neckline in a regular pattern, short the asset.
- Long trade: If price breaks above the neckline in an inverse pattern, go long.
- Always wait for a confirmation candle before entering.
3. Setting Stop-Loss and Take Profit
- Place a stop-loss above the right shoulder (for regular H&S) or below the right shoulder (for inverse H&S).
- Measure the distance from the head to the neckline, then set your target price by projecting this same distance below (for bearish) or above (for bullish).
Example:
- If the distance from the Head to the Neckline is $20, set the target at least $20 below (for a short trade) or $20 above (for a long trade).
4. Using Volume to Confirm the Pattern
- Low volume during the right shoulder means the trend is weak.
High volume on breakout means strong confirmation.
Common Mistakes Traders Make
1. Entering Too Early
- Don’t jump in before the neckline breaks. The pattern isn’t valid until this happens.
2. Ignoring Volume
- If the breakout doesn’t have strong volume, it might be a false breakout.
3. Not Setting a Stop-Loss
- Markets can be unpredictable. Always set a stop-loss in case the pattern fails.
Final Thoughts
The Head and Shoulders pattern is one of the most reliable reversal indicators in trading. It helps you exit early before a downtrend or enter early before an uptrend.
To recap:
- Regular H&S = Bearish Reversal
- Inverse H&S = Bullish Reversal
- Neckline Breakout Confirms the Trend Change
- Volume Confirms Strength of Breakout
- Use Stop-Loss and Take-Profit for Risk Management
Next time you see this pattern forming on a chart, you’ll know exactly what to do!
Now, go ahead and start spotting these patterns in live markets. The more you practice, the sharper your trading skills will become.
FAQs
The Head and Shoulders pattern is a chart formation that signals a trend reversal, either bearish (regular) or bullish (inverse).
Look for three peaks: a higher middle peak (head) between two lower peaks (shoulders), with a neckline acting as support or resistance.
Traders enter positions after a neckline breakout, using stop-losses near the right shoulder and targeting a price equal to the head-to-neckline distance.
Yes, it’s one of the most trusted reversal patterns, but confirmation with volume and other indicators is essential to avoid false breakouts.